
MCP Insights
Open Platform → MCP Insights in the Blotout Cloud web app. MCP Insights gives administrators visibility into how the Cloud MCP Server is used — who is querying data, what they are doing, and how much Athena compute it costs.
Time range
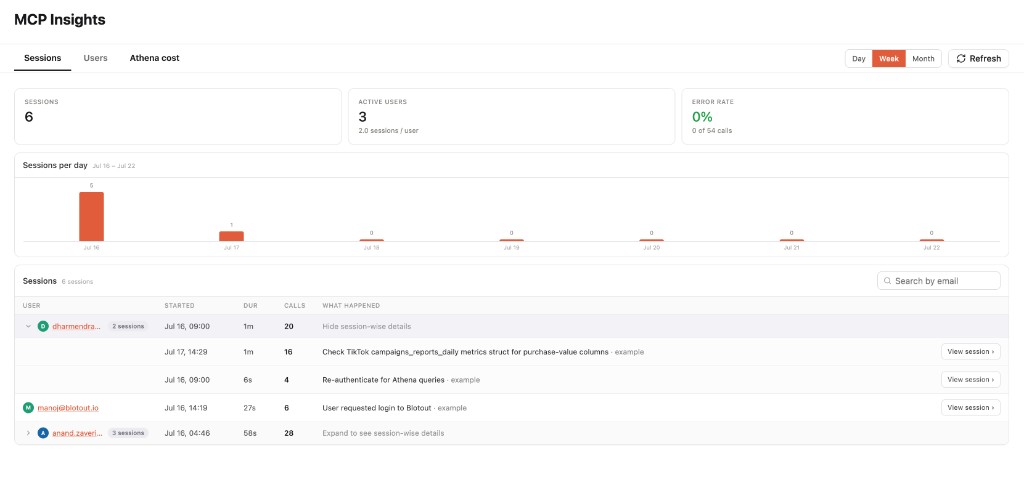
Section titled “Time range”Use Day, Week, or Month in the top-right toolbar to change the reporting window. Click Refresh to reload the latest data.
Sessions
Section titled “Sessions”The Sessions tab is the default view. It summarizes MCP activity for the selected range.
Summary KPIs
Section titled “Summary KPIs”| Metric | Description |
|---|---|
| Sessions | Total MCP sessions in the selected period |
| Active Users | Unique users with at least one session, plus average sessions per user |
| Error Rate | Share of MCP calls that failed, with failed vs. total call counts |
Sessions per day
Section titled “Sessions per day”Bar chart of daily session volume across the selected range. Use it to spot usage spikes or quiet periods.
Session log
Section titled “Session log”Searchable table of individual sessions. Filter by email with the search box.
| Column | Description |
|---|---|
| User | Email of the person who started the session |
| Start Time | When the session began |
| Dur | Session duration |
| Calls | Number of MCP tool calls in the session |
| What Happened | Short summary of the primary action (for example, a query, login, or metadata lookup) |
Click View session on any row to open the full session detail.
Switch to the Users tab to compare activity across your team.
Most active users
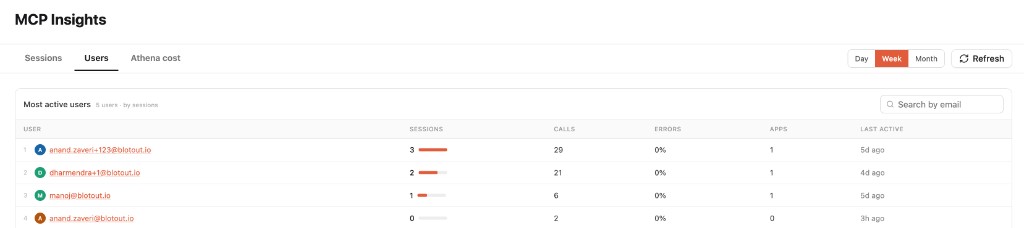
Section titled “Most active users”Ranked table of users by session count. Search by email to find a specific person.
| Column | Description |
|---|---|
| Sessions | Total sessions in the range, with a bar showing relative volume |
| Calls | Total MCP tool calls |
| Errors | Error rate for that user |
| Apps | Number of applications the user worked with |
| Last Active | How recently the user had an MCP session |
Click a user row to open their detail page.
User detail
Section titled “User detail”The per-user view breaks down how one person uses MCP over the selected range.
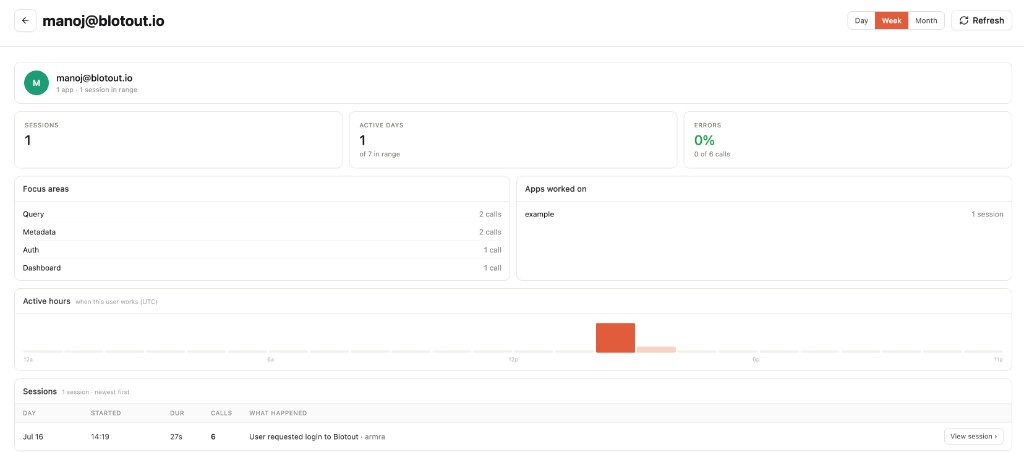
| Section | Description |
|---|---|
| Sessions | Total sessions for this user |
| Active Days | Days with at least one session, out of days in the range |
| Error Rate | Failed calls as a percentage of total calls |
| Focus Areas | Call volume by category — Query, Metadata, Auth, and Dashboard |
| Apps Worked On | Applications the user accessed, with session counts per app |
| Active Hours | Bar chart of when the user is most active (UTC) |
| Session details | Chronological log with start time, duration, call count, and action summary |
Athena cost
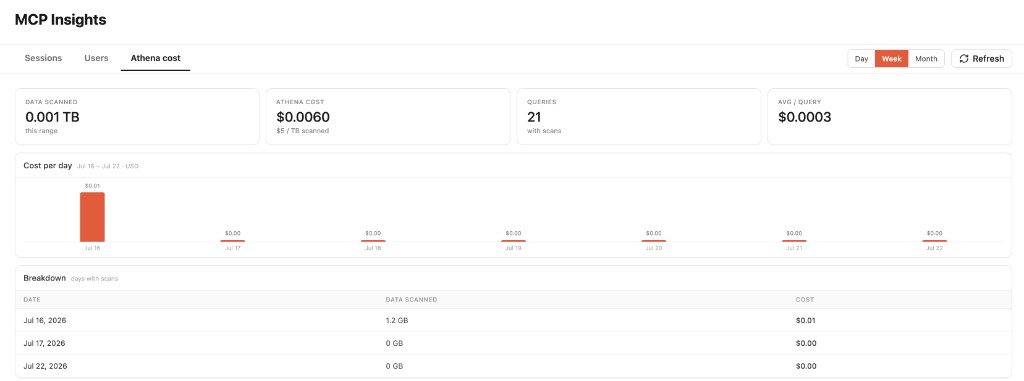
Section titled “Athena cost”The Athena cost tab tracks AWS Athena spend driven by MCP queries.
Summary KPIs
Section titled “Summary KPIs”| Metric | Description |
|---|---|
| Data Scanned | Total data scanned by Athena in the selected range |
| Athena Cost | Estimated cost at the standard Athena rate ($5 / TB scanned) |
| Queries | Number of queries with non-zero scans |
| Avg / Query | Mean cost per query |
Cost per day
Section titled “Cost per day”Bar chart of daily Athena spend across the range.
Breakdown
Section titled “Breakdown”Table of days that had scan activity, with data scanned and cost per day. Use this to tie usage back to specific dates and audit expensive query days.
When to use MCP Insights
Section titled “When to use MCP Insights”- Adoption — See which teams and users are actively using MCP.
- Reliability — Watch error rates at the session, user, and call level.
- Cost control — Monitor Athena scan volume and daily spend before it grows unexpectedly.
- Audit — Review session logs and per-user activity for compliance or troubleshooting.