
Event Stream
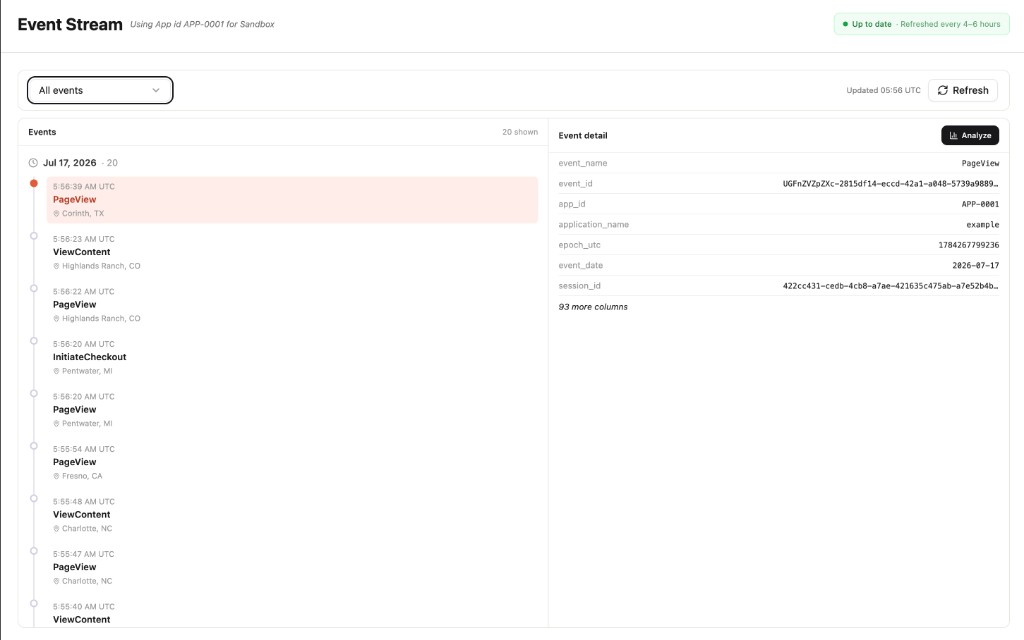
Open Analytics → Event Stream in the Blotout Cloud web app. Event Stream is a live explorer for ingested events for the selected App ID and Tag.
Layout
Section titled “Layout”| Pane | What it shows |
|---|---|
| Events (left) | Chronological list of recent events, grouped by date |
| Event detail (right) | Key fields for the selected event |
Each list row shows timestamp, event name, and geo city. The header shows how many events are displayed (for example, 20 shown) and when data was last refreshed.
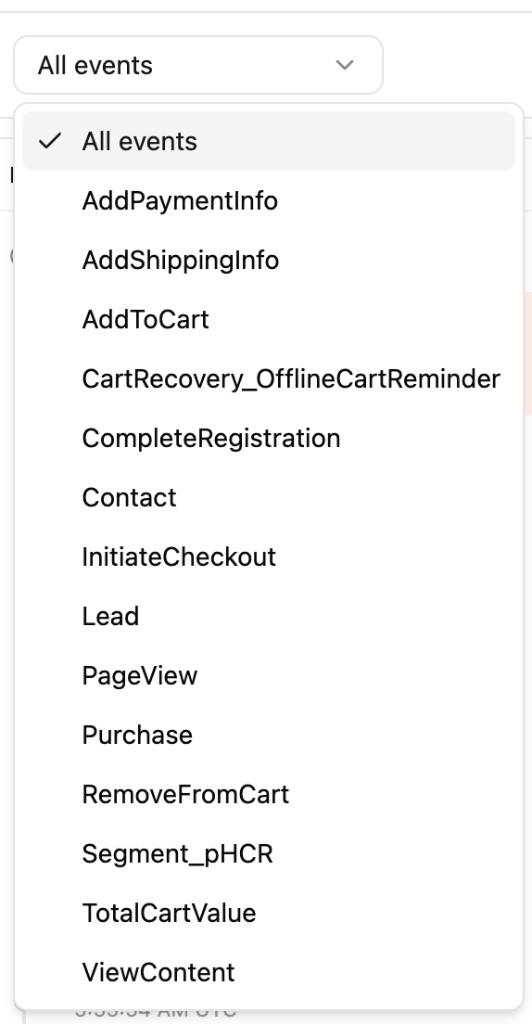
Filter by event type
Section titled “Filter by event type”Use the All events dropdown to limit the stream to a single event name (for example PageView, Purchase, AddToCart) or keep All events.
Event detail
Section titled “Event detail”Selecting an event opens its fields in the right pane, including identifiers and context such as:
event_name,event_id,event_date,epoch_utcapp_id,application_namesession_id
Only a subset of columns is shown first. Use the footer note (for example 93 more columns) to understand how much of the full payload remains.
Analyze
Section titled “Analyze”Click Analyze in the event detail header to open column profiling for that event type over the selected date range.
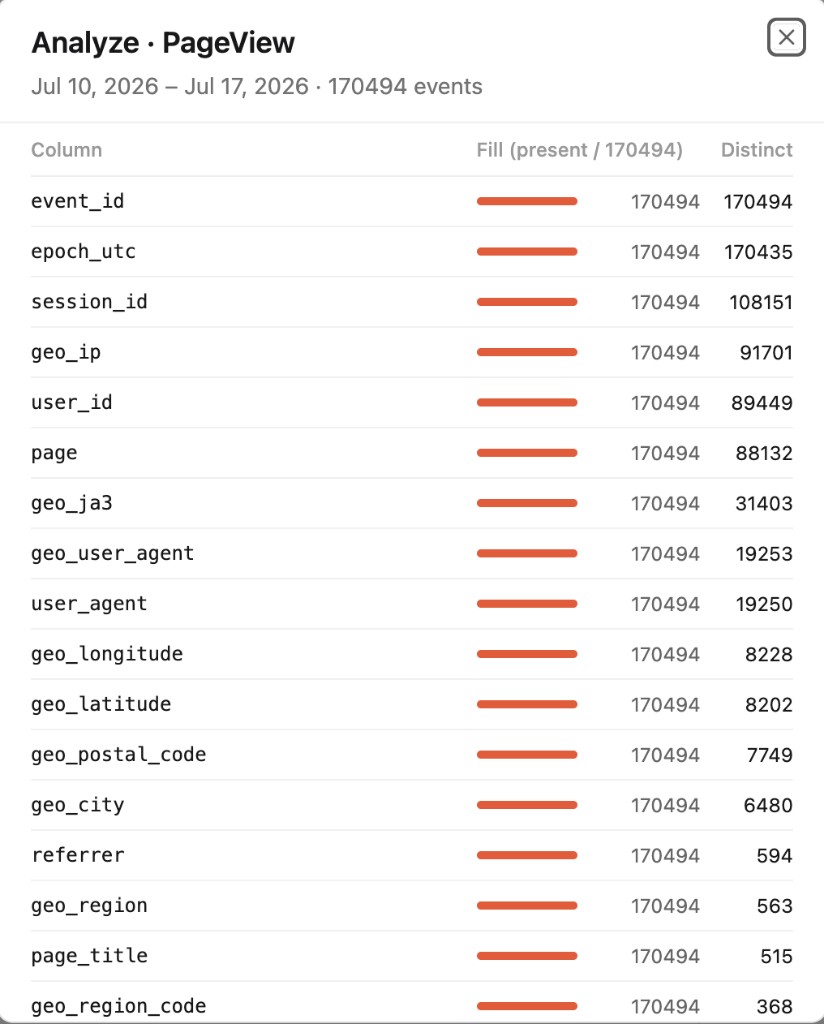
The Analyze view reports:
| Column | Meaning |
|---|---|
| Column | Field name on the event |
| Fill | How many events have a non-empty value (with a fill bar) |
| Distinct | Count of unique values for that field |
Use it to check data completeness and cardinality (for example session IDs, pages, geo fields) before relying on a field in dashboards or segments.
Refresh
Section titled “Refresh”Data refreshes on a schedule (typically every 4–6 hours). Use Refresh in the toolbar to reload the current view.