
Shopify Dashboard
Open Analytics → Shopify in the Blotout Cloud web app.
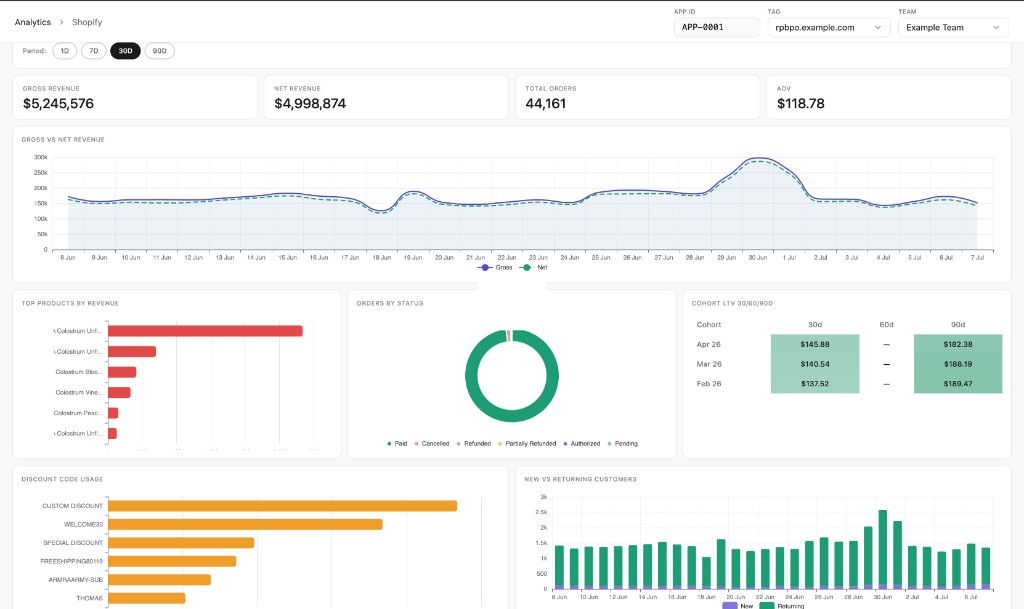
The dashboard surfaces six areas of Shopify performance:
Summary KPIs — Gross revenue, net revenue, total orders, and average order value (AOV) for the selected period.
Gross vs Net Revenue — Daily trend comparing gross and net revenue over the selected window.
Top Products by Revenue — Horizontal bar chart ranking products by revenue contribution.
Orders by Status — Breakdown of orders by status (for example, paid, cancelled, refunded).
Cohort LTV (30 / 60 / 90D) — Table showing customer lifetime value by acquisition cohort at 30-, 60-, and 90-day intervals.
Discount Code Usage — Most-used discount codes ranked by redemption volume.
New vs Returning Customers — Daily stacked view of new and returning customer orders.
Data refresh
Section titled “Data refresh”Data is populated after the Shopify ELT pipeline syncs orders and the shopify_dashboards Airflow DAG completes its dbt run. See Data Pipelines to connect a Shopify source.