
Attribution Dashboard
Open Analytics → Attribution in the Blotout Cloud web app. The dashboard compares how revenue credit is assigned across marketing channels under different attribution models.
In addition to the shared dashboard filters, Attribution includes:
| Control | Purpose |
|---|---|
| Lookback (7D / 30D / 60D / 90D) | How far back before a purchase to credit upstream touches |
| Model toggles | Select which attribution models to compare |
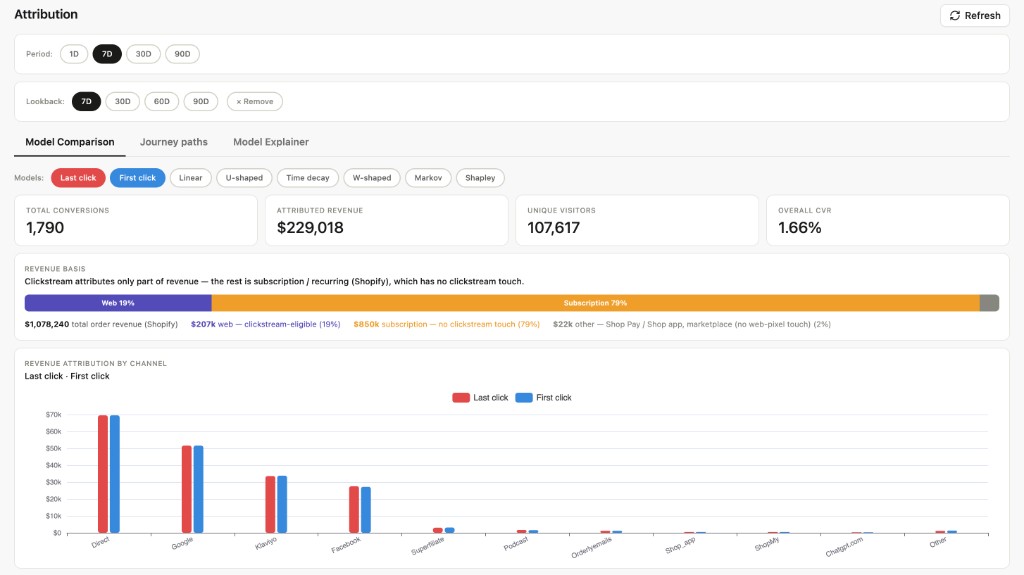
Summary KPIs for the selected period: total conversions, attributed revenue, unique visitors, and overall conversion rate (CVR).
Select one or more models to compare — Last click, First click, Linear, U-shaped, Time decay, W-shaped, Markov, and Shapley.
Revenue Basis — Shows how much of total Shopify order revenue is clickstream-eligible versus subscription / recurring or other non-web touches. Clickstream attribution only covers the web portion; subscription revenue (for example from Recharge) and marketplace / Shop app orders have no clickstream touch and are excluded from channel attribution.
| Segment | Meaning |
|---|---|
| Web | Clickstream-eligible revenue with tracked marketing touches |
| Subscription | Recurring / subscription revenue with no clickstream touch |
| Other | Shop Pay, Shop app, marketplace, and similar non-web-pixel orders |
Revenue Attribution by Channel — Grouped bar chart comparing attributed revenue per channel for each selected model (for example, Direct, Google, Klaviyo, Facebook, affiliates, podcast, and email). Use this to see how credit shifts when you change models.
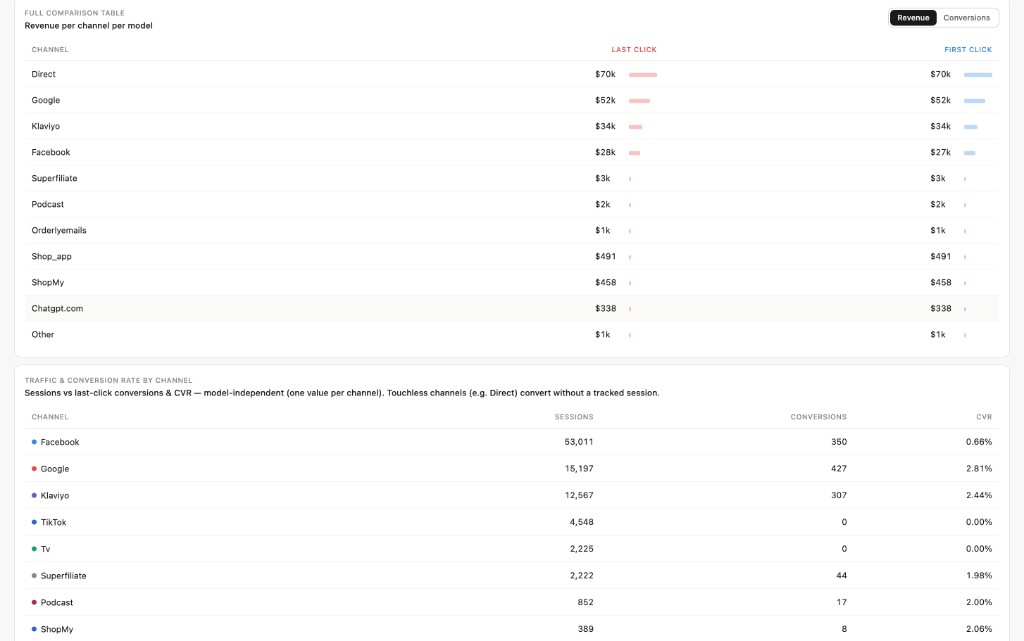
Full Comparison Table — Revenue (or Conversions) per channel per selected model. Toggle between Revenue and Conversions to switch the metric. Each column shows the attributed value for that model with a relative bar.
Traffic & Conversion Rate by Channel — Sessions, last-click conversions, and CVR per channel. These values are model-independent (one value per channel). Touchless channels such as Direct can convert without a tracked session.
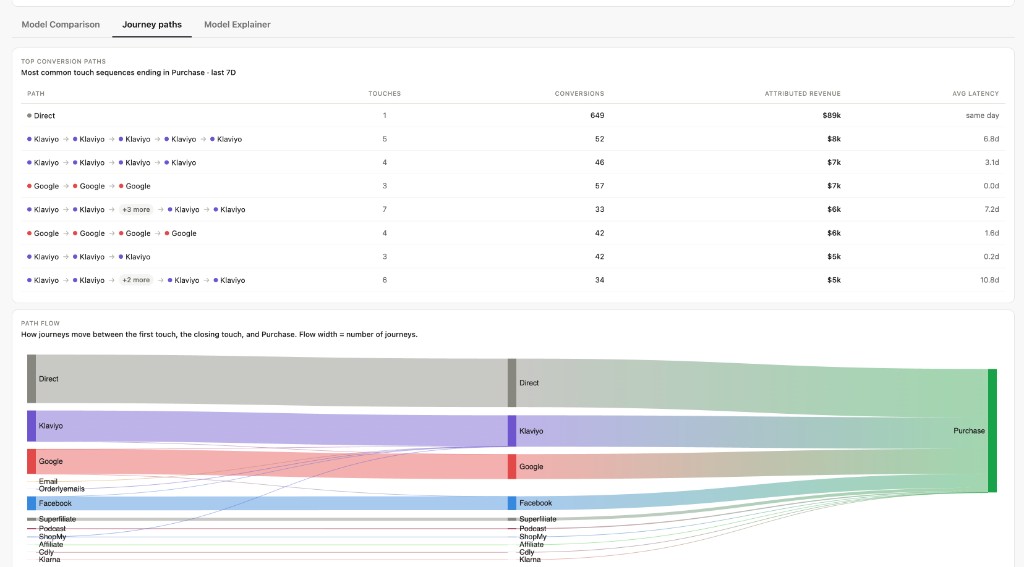
Top Conversion Paths — Table of the most common touch sequences ending in Purchase. Columns include path, touch count, conversions, attributed revenue, and average latency from first touch to purchase.
Path Flow — Sankey diagram showing how journeys move from first touch through closing touch to Purchase. Line width reflects journey volume across channels such as Direct, Klaviyo, Google, and Facebook.
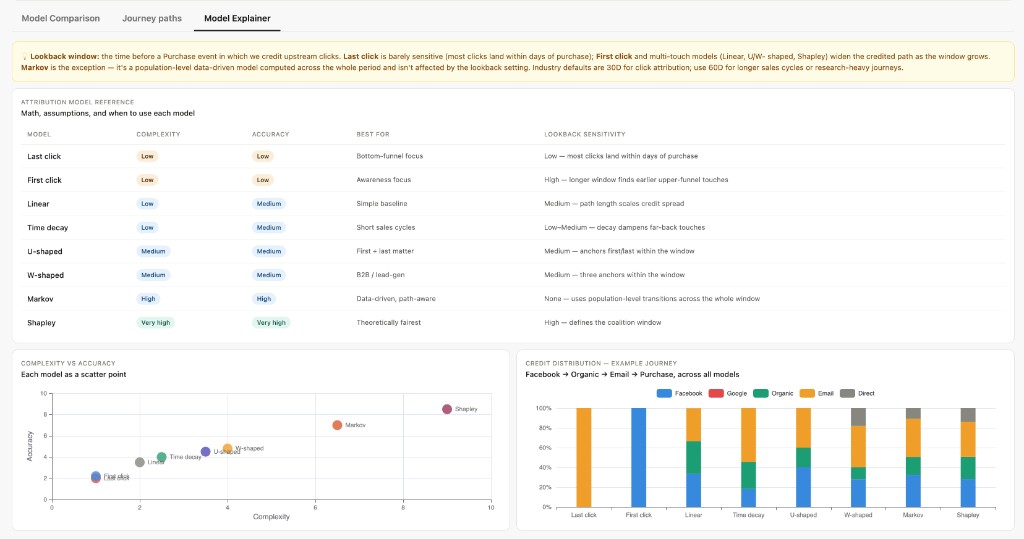
Reference guide for each attribution model: complexity, accuracy, best use case, and lookback sensitivity.
Lookback window — The time before a Purchase event in which upstream clicks are credited. Last click is least sensitive to lookback changes; First click and multi-touch models widen credited paths as the window grows. Markov is population-level and not affected by lookback settings. Industry default is 30 days; 60 days is recommended for longer sales cycles.
Complexity vs Accuracy — Scatter plot positioning each model by implementation complexity and attribution accuracy.
Credit Distribution — Example Journey — Stacked bar chart showing how credit is split across a sample journey (Facebook → Organic → Email → Purchase) under each model.
Data refresh
Section titled “Data refresh”Data is populated from EdgeTag event ingestion and the attribution_dashboard Airflow DAG. See Data Pipelines and Data Schema for event requirements.