
Marketing Performance
Open Analytics → Marketing Performance in the Blotout Cloud web app. The dashboard consolidates ad spend and revenue across channels so you can judge efficiency without switching between ad managers.
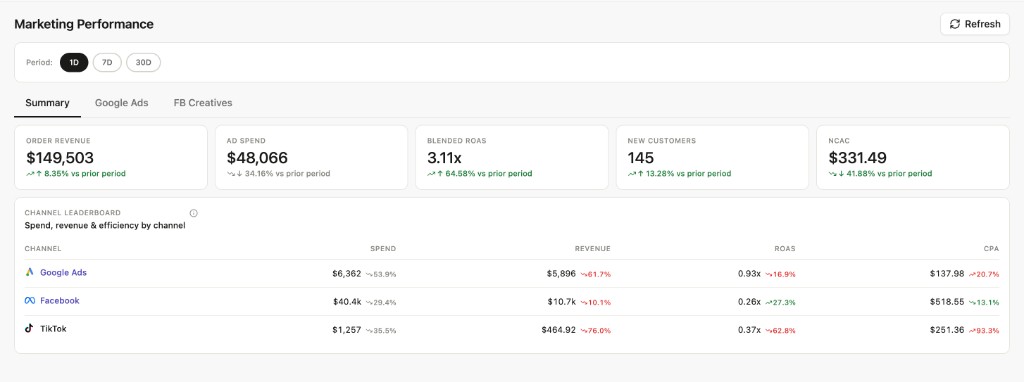
Blended view across channels for the selected period.
KPI cards — Order Revenue, Ad Spend, Blended ROAS, New Customers, and NCAC (new customer acquisition cost).
Channel Leaderboard — Spend, revenue, ROAS, and CPA by channel (for example Google Ads, Facebook, TikTok) so you can compare efficiency side by side.
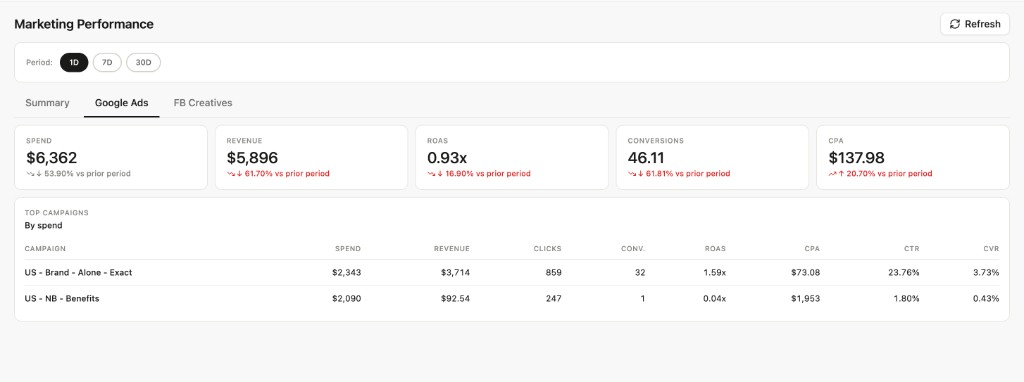
Google paid performance for the same period.
KPI cards — Spend, Revenue, ROAS, Conversions, and CPA, each with prior-period change.
Top Campaigns (by spend) — Campaign-level table with Spend, Revenue, Clicks, Conversions, ROAS, CPA, CTR, and CVR.
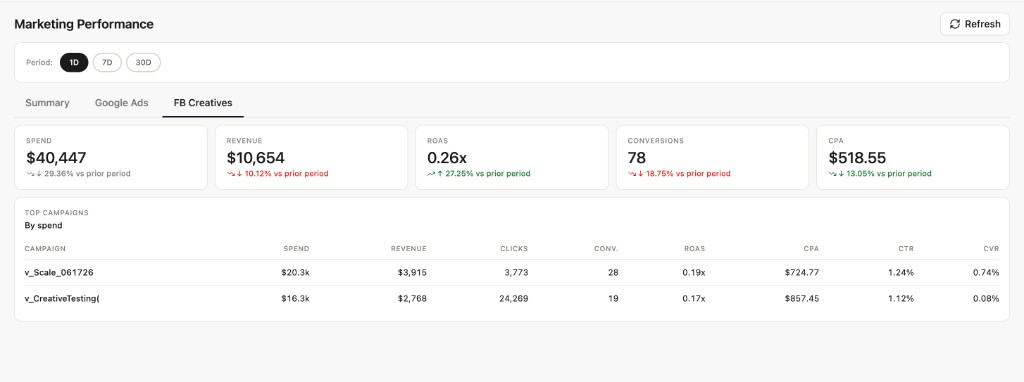
Facebook / Meta paid performance for the same period.
KPI cards — Spend, Revenue, ROAS, Conversions, and CPA, each with prior-period change.
Top Campaigns (by spend) — Campaign-level table with Spend, Revenue, Clicks, Conversions, ROAS, CPA, CTR, and CVR for Meta campaigns and creative tests.
Data refresh
Section titled “Data refresh”Metrics appear after the relevant ad and commerce pipelines sync and dashboard DAGs finish. Connect sources under Data Pipelines (for example Google Ads, Facebook Marketing, and your store pipeline) before expecting populated cards and tables.