
Clickstream Dashboard
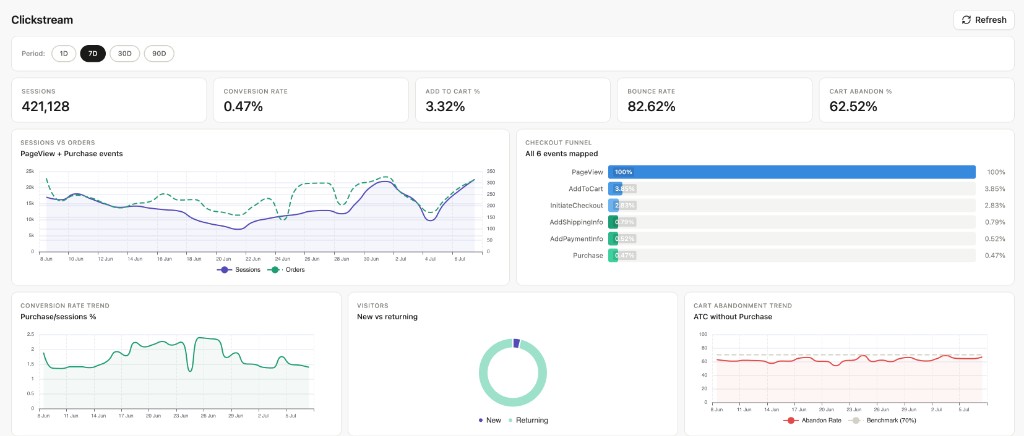
Open Analytics → Clickstream in the Blotout Cloud web app. The dashboard tracks on-site user behavior from page views through purchase.
Summary KPIs
Section titled “Summary KPIs”| Metric | Description |
|---|---|
| Sessions | Total user sessions in the selected period |
| Conversion Rate | Purchases as a percentage of sessions |
| Add to Cart % | Sessions that reached add-to-cart |
| Bounce Rate | Sessions with a single page view and no further engagement |
| Cart Abandon % | Add-to-cart sessions that did not complete purchase |
Sessions vs Orders
Section titled “Sessions vs Orders”Line chart comparing daily sessions (solid) against orders (dashed) over the selected window. Built from PageView and Purchase events.
Checkout Funnel
Section titled “Checkout Funnel”Horizontal bar chart mapping all six funnel stages and their drop-off rates:
- PageView — 100% baseline
- AddToCart
- InitiateCheckout
- AddShippingInfo
- AddPaymentInfo
- Purchase
Use this to see where users exit the checkout path.
Conversion Rate Trend
Section titled “Conversion Rate Trend”Daily purchase-to-sessions percentage over the selected period.
Visitors
Section titled “Visitors”Donut chart showing the split between new and returning visitors.
Cart Abandonment Trend
Section titled “Cart Abandonment Trend”Daily cart abandonment rate (add-to-cart without purchase) compared against a 70% benchmark line.
Data refresh
Section titled “Data refresh”Data is populated from EdgeTag event ingestion and the clickstream_dashboard Airflow DAG. See Data Pipelines and Data Schema for event requirements.